 Money. The driving factor at the end of the day to make sure bills are paid and food is on the table. Everything comes at a cost, especially change within your family farm operation. Suggested changes are often quickly dismissed because capital outlay is high. Utilizing Key Performance Indicators (KPI’s) in your operation can help drive appropriate change. Clean and concise records are a valuable aid in projecting, defining, and validating the resulted savings of these improvements.
KPI’s allow success to be measured both analytically and financially. They identify leading and lagging indicators when changes specific to your operation are implemented. Before changes are defined, articulated current performance must be analyzed. Understanding current performance will help guide your farm in the direction needed to achieve its long-term goals.
The following real examples represent measurable downstream improvements easily shown using Key Production Indicators. Please note: data set figures are producer specific.
Example 1: Sow Source Mycoplasma Hyopneumoniae Elimination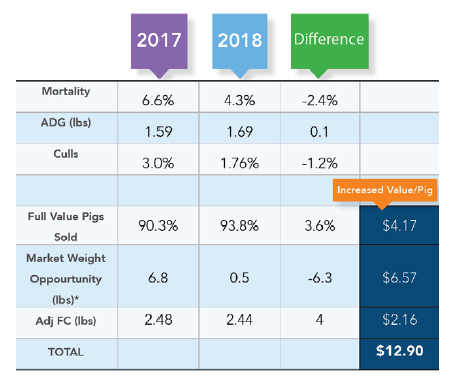
Mycoplasma elimination at a sow farm comes at a cost- between exposure, antimicrobial therapy, supplies, and labor, estimated cost in this example was approximately $.69 per weaned pig. However, as seen in Table 1 below, the data validates the decision. Mortality and ADG made 2.4% and 6.2% improvements respectively. These significant changes resulted in 3.6% more full value pigs sold and allowed this producer to hit their target market weight which was not being realized in 2017 before the elimination. Add an additional $2/hd for the feed conversion bump and total ROI on this decision came to just over $12 per wean pig placed.
Example 2: Change in Nutrition Platform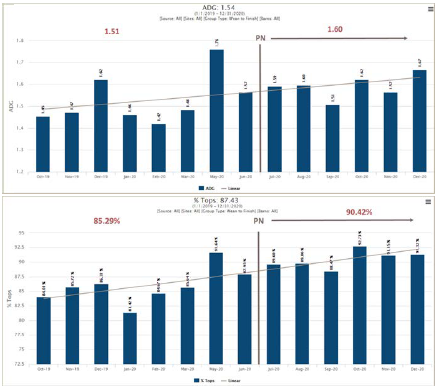
It’s no secret that feed is the single biggest expense to raising a market hog. Here a change in nutrition platform was a good economical choice while also returning an increase in performance. You see this denoted on the slides with a “break” between groups closed in June of 2020 versus groups closed in July of 2020 and on.
In the graphs to the right, the change is marked with a solid line (numbers in red represent the wean to finish averages pre and post). Estimated return on selling over 5% more full value pigs is $7.04/pig placed.
Example 3: Upgrade Sow Source 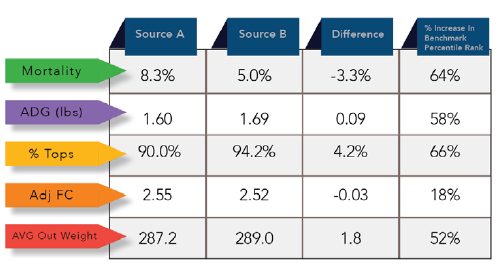
In this example we can see how a change from an unhealthy source to a healthy source can play a crucial role in grow finish performance. A healthy pig coming into your barn that is eager to eat, thrifty in body condition, and active will create a consistent and uniform group within your barn (it also boosts the morale of your caretaker!). A healthy pig in combination with the correct environment, nutrition, and caretaker, creates biological and financial improvements in productivity and profitability for the producer.
The chart below depicts one producer over the course of 5 years. We’re able to easily identify when the source change was implemented. Source A encompasses 3 years of data (2016-2018) and includes health levels of PRRS Stable, PRRS Active, and PED+. Source B encompasses 2 years of data (2019-current) with a health level of PRRS Negative. The decision to invest in sow farm ownership moved this producer from a below average performer to a consistent top 20% producer.
Utilizing a KPI concept on your farm can provide quick and valuable validation to implemented changes within your operation. Adopting a KPI process can also serve as a strong communication tool to drive both improvement and recognize success.
If you are interested in learning more about the Pipestone FarmStats service, please contact Kendra Burchett at kendra.burchett@pipestone.com (507) 215-5036 or Angie Homann at angie.homann@pipestone.com (507) 215-5093 to discuss the best option for you.
By: Kendra Burchett

Information Supervisor, Pipestone Business